Psychrometric chart (Mollier diagram)
Follow us on Twitter ![]()
Question, remark ? Contact us at powder.process@protonmail.com
| Section summary |
|---|
| 1. What is a
psychrometric chart / Mollier diagram ? |
| 2. Psychrometric
chart picture |
| 3. The chart explained |
1. Introduction
What is a psychrometric chart or Mollier Diagram ?
The psychrometric chart is used for all operations handling humid
air. It allows to quickly relates the specific heat of air, the absolute
humidity, relative
humidity and temperature. It is used to calculate heat
loads for air handling systems for example.
Note that the Mollier diagram is actually identical to the
psychrometric chart but just mirrored and turned 90 degrees.
2. Psychrometric chart
The diagram is shared under creative common licence from Wikipedia, author ArthurOgawa : link. The file is svg, please download it for high definition.

3. The Psychrometric chart explained
How to read / use a psychrometric diagram or a Mollier diagram ?
Each point of the graph allows to
determine :
- Dry bulb temperature
- Wet bulb temperature
- Dew point
- Enthalpy
- Relative humidity
- Absolute humidity
- Specific volume
| Dry Bulb Temperature | 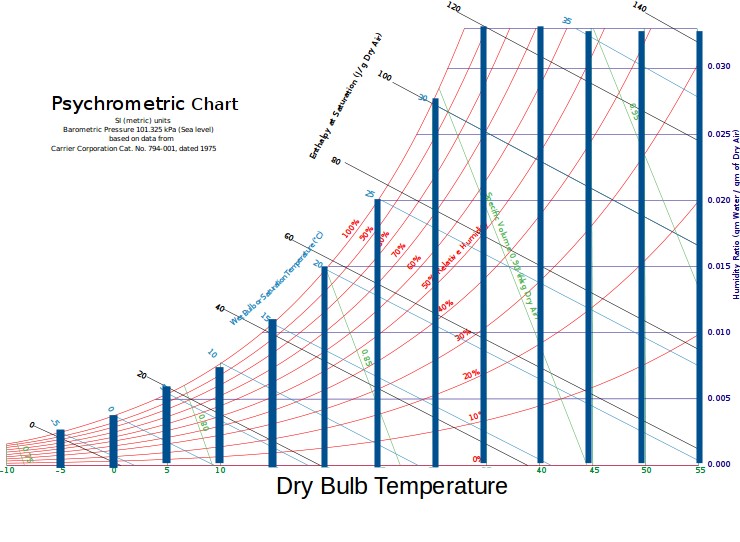 |
| Wet Bulb Temperature | 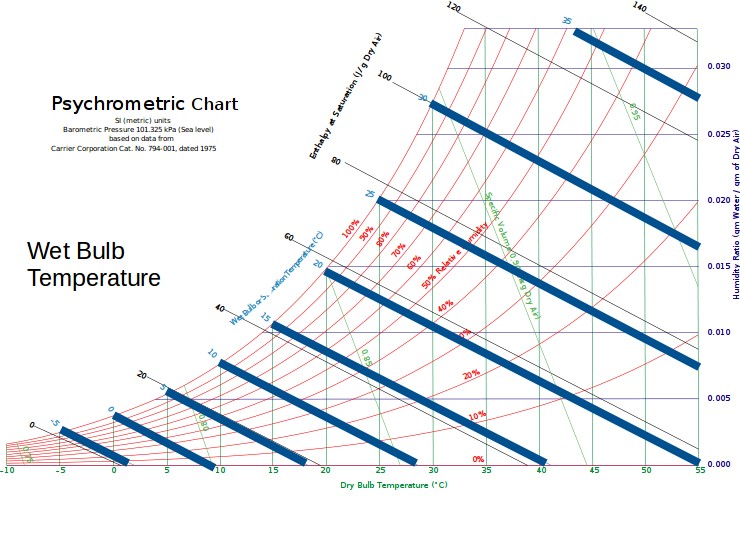 |
| Dew Point Temperature | 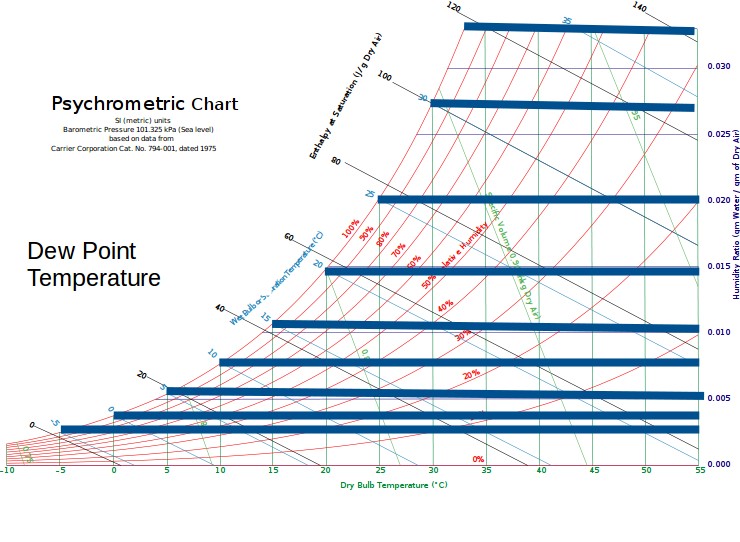 |
| Enthalpy |  |
| Relative humidity - red curves on the graph | 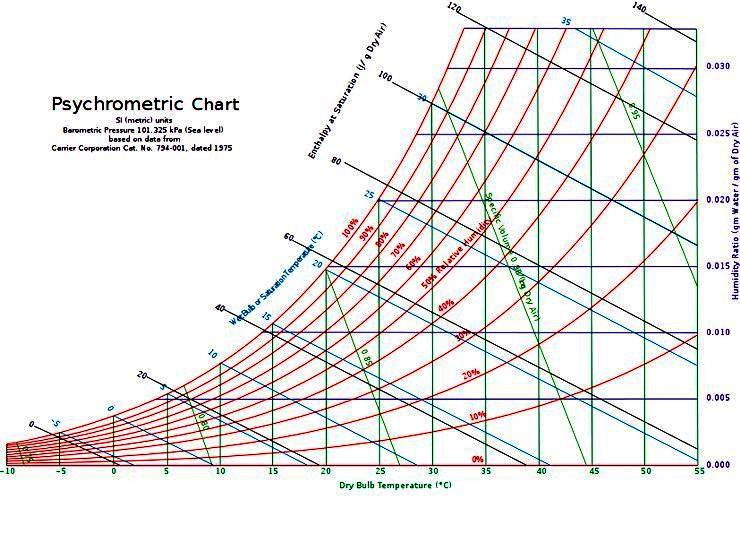 |
| Absolute humidity |  |
| Specific volume | 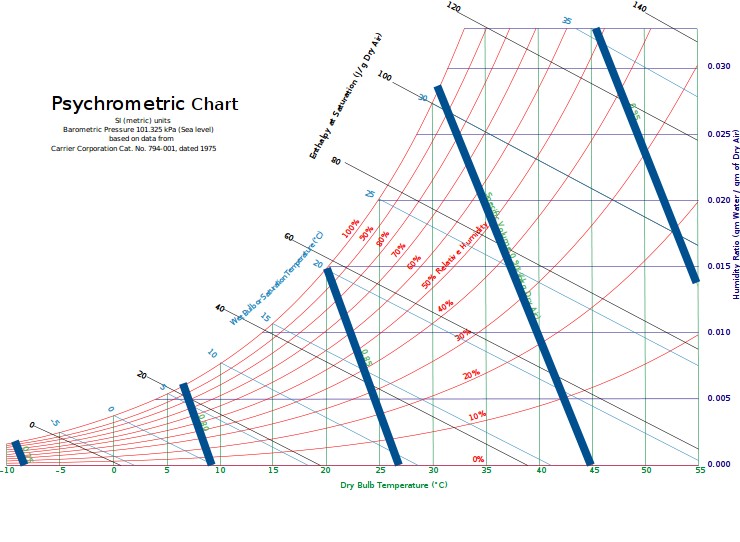 |
The graph can also be used to
determine the heat exchange required to go from one state to another.
The heat exchange corresponds to the difference in between the
enthalpy of points A and B. The example below shows the cooling of air
from conditions A to B, reading the enthalpies for the 2 points allow
to calculate a cooling requirement of 60-40 = 20 J/kg of dry air.
